1970s detached home
Could your home be made warmer, cheaper to run, and better for the planet? See what’s possible when you take a whole-home approach to planning energy upgrades.
What’s the potential of a home like this?
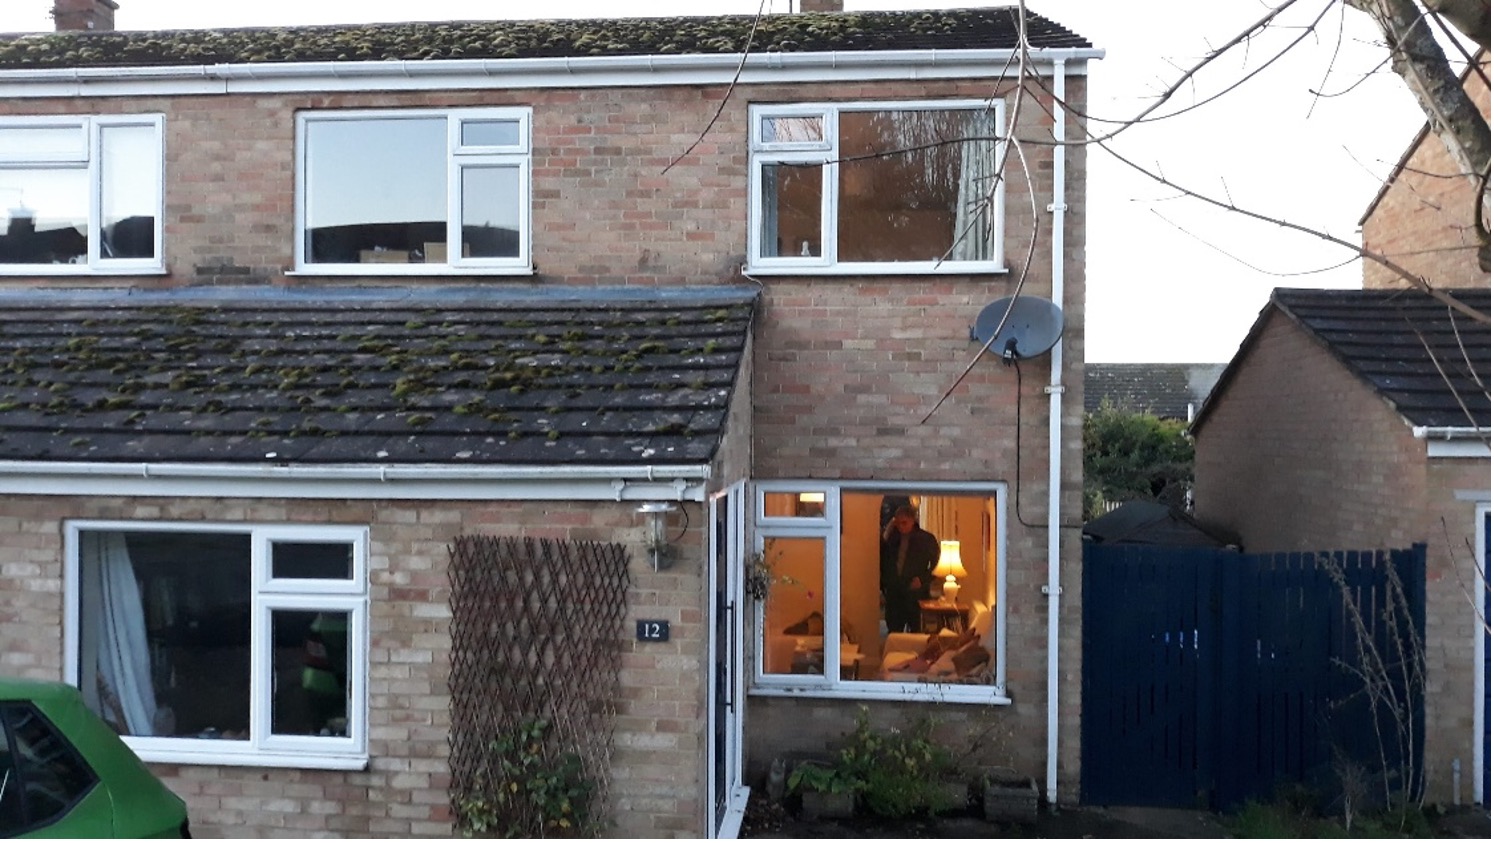
This 1970s semi-detached home in Charlbury, Oxfordshire, is typical of thousands built at the time. It has cavity walls (some filled, some unfilled), solid floors, and a pitched loft roof.
The owners wanted to make the house cosier and less draughty. They also wanted to cut carbon and reduce running costs. With a Whole House Plan, they could see which steps to take first. They began by upgrading cavity wall insulation, improving the loft, and replacing the windows.
Here’s what the plan revealed:
| Carbon emissions could be cut by over 95% |
| The EPC rating could rise from 66 D to 96 A |
| Annual fuel bills could drop from around £1,268 to under £250 |
You don’t have to carry out every measure at once. The Whole House Plan gives you a roadmap so you can make improvements in your own time, at your own pace, and within your budget.

“Cosy Homes helped us identify key measures to improve the comfort of our home. With their help, we upgraded our cavity wall insulation, improved our loft insulation and replaced all our windows. The house now feels cosier and less draughty.”
Christine and Ted, Charlbury
Where this home stands now
House profile
| EPC rating | Current 66 D > Potential 96 A |
| Type | Semi-detached |
| Built | 1970s |
| Location | Charlbury |
| Occupancy | Owner-occupied |
| Bedrooms | 3 |
| Floor area | 93m² |
| Walls | Cavity, filled and unfilled |
| Floors | Solid |
| Roof | Pitched with loft |
| Windows | Double glazed, uPVC |
| Annual energy use | 17,121 kWh (184 kWh/m²) |
| Carbon emissions | 3.5 tonnes CO2/year |
The EPC rating: now vs potential
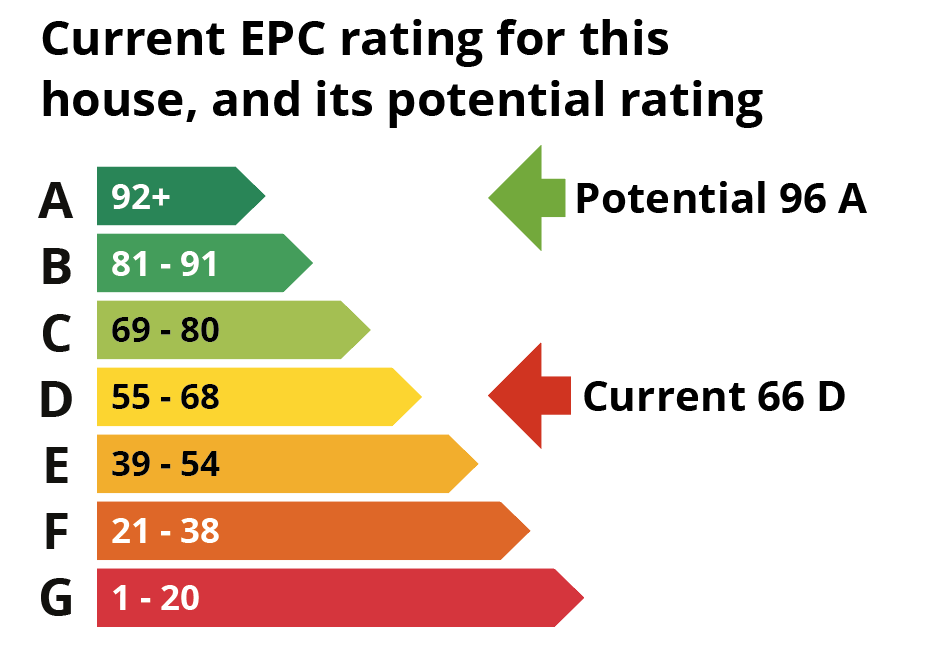
An EPC rates your home’s energy efficiency – from A (best) to G (worst). A higher score can mean lower bills, but it doesn’t guarantee comfort. Whole-home upgrades help bridge that gap.
Long-term comfort, short-term disruption
| Key to tables: | Low impact: • | High impact: •••••• |
| Minor measures | Comfort & health | Disruption |
|---|---|---|
| Low energy lighting | • • | • |
| Insulate inaccessible loft space | • • • • | • • |
| Increase loft insulation to 300mm | • • • • | • • |
| Insulate and draught proof loft hatch | • • • • | • |
| Cavity wall insulation | • • • • | • • |
| New insulated front door | • • • • • | • • |
| Ventilation improvements | • • • • • | • • |
| Major measures | Comfort & health | Disruption |
|---|---|---|
| External wall insulation to cavity walls | • • • • • | • • • |
| Insulate solid floor | • • • • • | • • • |
| New double or triple glazed uPVC windows | • • • • • • | • • • • |
| Air source heat pump | • • • • • • | • • • • |
| Renewables | Comfort & health | Disruption |
|---|---|---|
| Solar PV | • | • • |
Expert tip

“This house only needs to carry out a couple of fabric improvements to bring its energy rating to C. Once the loft insulation has been increased and the cavity walls checked then this house should be suitable for a heat pump.”
Geordie Stewart, Scheme Manager
The difference each step could make
These figures show how each recommended measure could affect the home’s EPC rating, energy bills, and carbon emissions – if installed in the order shown. They’re based on a full Whole House Plan tailored to this property.
| Measure | Est. cost | EPC | Fuel bill | CO2/year |
|---|---|---|---|---|
| Where you are now | – | 66 D | £1,268 | 3.53 t |
| Low energy lighting | £50–£100 | 68 D | £1,186 | 3.51 t |
| Insulate inaccessible loft space | £1.3k–£2k | 68 D | £1,171 | 3.46 t |
| Increase loft insulation | £1.5k–£1.9k | 69 C | £1,139 | 3.34 t |
| Ventilation improvements | £1k–£1.3k | 69 C | £1,139 | 3.34 t |
| External wall insulation | £22.5k–£27k | 72 C | £1,036 | 2.97 t |
| Insulate solid floors | £11.5k–£14k | 73 C | £972 | 2.73 t |
| Triple glazed windows | £8.5k–£13.5k | 76 C | £869 | 2.35 t |
| New insulated doors | £4.2k–£5.4k | 77 C | £848 | 2.27 t |
| Air source heat pump | £7.5k–£12.5k | 85 B | £668 | 0.38 t |
| Solar PV (2.5 kWp) | £4.5k–£6k | 96 A | £239 | 0.07 t |
Boost your EPC rating
Installing a single major system like a heat pump or solar panels can still make a big difference. These examples show how individual upgrades could shift the home’s EPC and reduce carbon emissions – even before doing everything else.
| Upgrade option | EPC rating | Fuel bill | CO2 emissions |
|---|---|---|---|
| Just solar PV | 81 B | £720 | 3.04 t |
| Just heat pump | 76 C | £1,064 | 0.60 t |
| Solar + heat pump | 87 B | £628 | 0.30 t |
Expert tip

“It’s unclear whether all the walls of this house have cavity wall insulation. We’d recommend a borescope survey to check the coverage and confirm whether any empty cavities are suitable for filling.”
Natasha Ginks, Retrofit Coordinator
Wondering what’s right for your home?
A Whole House Plan gives you expert, independent advice on the best steps to take – and in what order – so every upgrade really works.
Don’t put it off another year. Take the first step with a free consultation. Our team of experienced Retrofit Advisers will listen to your goals, help you understand what’s possible, and outline the best next steps – no pressure, no obligation.
Smarter home upgrades. Backed by trusted retrofit expertise.
A House Like Mine
This case study is part of A House Like Mine – a collection of real Oxfordshire homes used to model the potential of energy-saving upgrades.
Each one is based on a Whole House Plan: expert guidance on what could be done, what it might cost, and what difference it could make.
These homes haven’t had the work done – but they show what’s possible when you plan it properly.
Prefer a PDF version?
Download a shareable PDF of this case study – perfect for your community group, local class, or anyone curious about improving home energy efficiency.
We’re making this resource freely available to raise awareness of how retrofitting – upgrading your home to use less energy and stay comfortable year-round – can make a real difference.
Click here to download the PDF